Investigating flame acceleration of premixed gases and how deflagrations transition to detonations is extremely important because of two main reasons: 1) from the safety point of view, we want to avoid severe explosions from happening inside processing units and storage facilities; and 2) because there is a growing interest in controlling these phenomena for more efficient energy conversion inside combustion engines. For instance, an extensive effort has been made towards the development of detonation engines. Detonation engines are powerful devices whose fundamental principle is based on multiple explosions of energetic fluids such as hydrogen gas. This technology is still in the early development stage but has excellent potential to replace current engines present in airplanes and rockets.
In our laboratory, we conduct experiments to investigate how flame acceleration and detonation onset will occur in the presence of obstacles with different geometries. The goal of this work is to identify the main features of unequal obstruction characteristics that interfere with flame propagation and DDT, namely: blockage ratio, obstacle spacing, or obstacle shape. Provided in the figure below is a typical result of a DDT test performed in our detonation rig, where a soot foil was used to visualize the transition process and obvious detonation (notable by the presence of the cellular structure).
This work is performed in collaboration with the Mary Kay O’Connor Process Safety Center at Texas A&M University. In the past, we have generated experimental data for validation purposes of a CFD model to determine the potential for DDT and estimate run-up distances at small scales. This information can later be used to help design safer facilities.

Soot foil showing DDT process in a stoichiometric H2-O2 mixture downstream of a pair of obstacles in the TAMU detonation tube.
Open-Ended Detonation Tube Facility
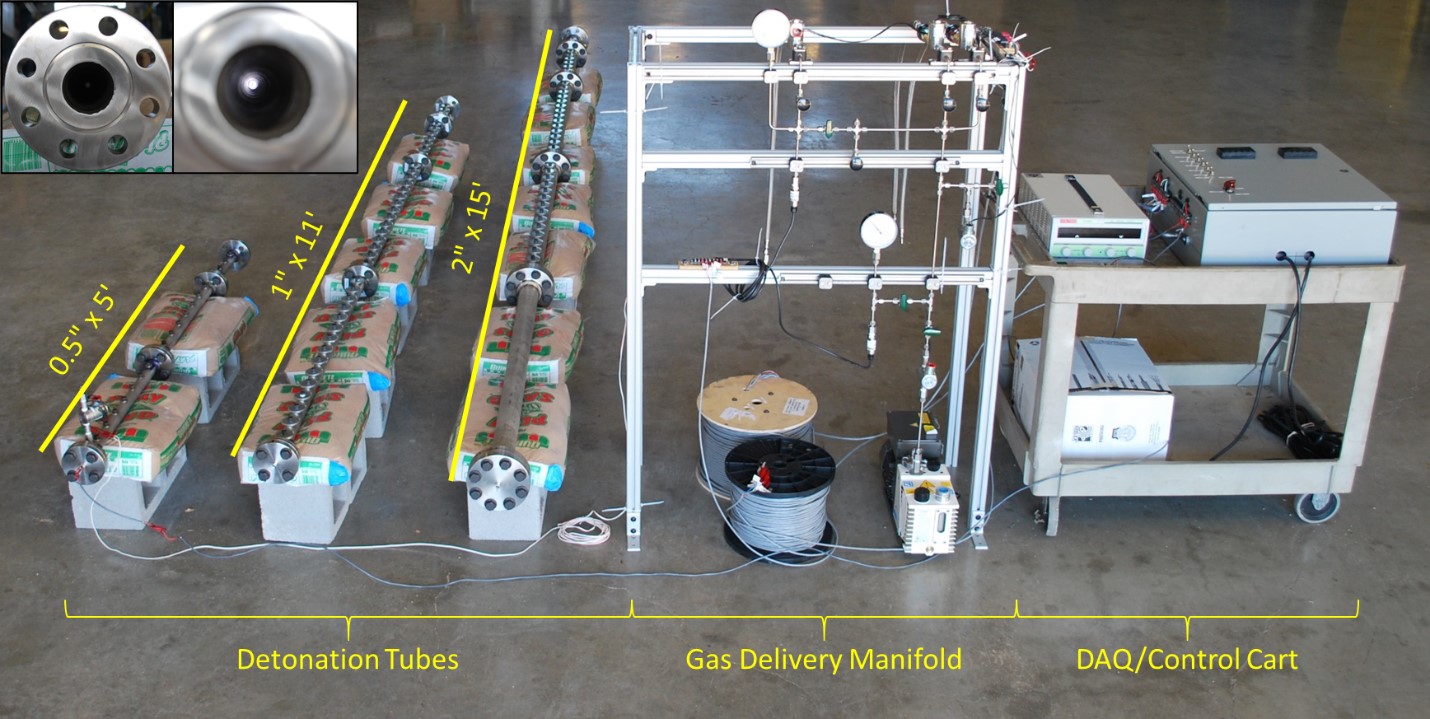
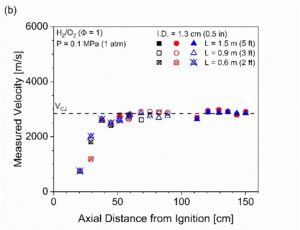
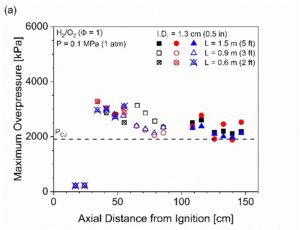
A new open-ended detonation tube facility was constructed for experiments in collaboration with Dr. Scott Jackson and Dr. Elaine Oran of the Department of Aerospace Engineering. The open-ended detonation tube facility includes three separate tubes with associated gas handling and vacuum systems and various instrumentation (e.g., dynamic pressure transducers, free-field microphones, etc.). The detonation tubes have internal diameters of ½ʺ, 1ʺ, and 2 ʺ with corresponding maximum lengths of 5′, 11′, and 15′, as shown in Fig. 1. The tubes are constructed from flanged sections such that thier lengths can be varied in 1′-increments. Instrumentation holes along the axis of each tube allows for accommodation of sensors. The detonation tubes are located in an open field at the Texas A&M UXO Range (RELLIS campus) during testing, and all gas filling operations and experiments are conducted remotely ( 1000′). Representative pressure and velocity measurements behind the flame front for a stoichiometric H2/O2 (Pi=1 atm) are shown in Fig. 2 wherein the DDT run-up is evident.
 Fig 1. Image of all three fully assembled detonation tubes, gas handling system, and deployable DAQ/control cart. Inset images show end views of the 5.08-cm (2ʺ) tube.


Fig 2. (a) Maximum overpressure data and (b) computed wave velocities insideof the detonation tube (ID =1.27 cm, L=0.6, 0.9, or 1.5 m) for a total of nine experiments conducted with stoichiometric H2/O2 (P=0.1 MPa). Symbol shapes represent replicate experiments, while different filling patterns represent different tube lengths.
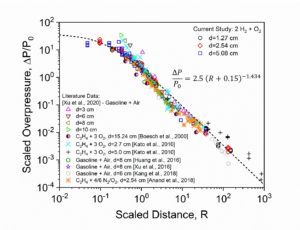
Recent experiments have focused on measurement and prediction of attenuation of the shockwave transmitted by a CJ detonation at the open end of a tube. A pressure rake system (Fig.3) allows for measurement of conditions behind shockwaves outside of the tube near its exit. A high-speed video still frame of shockwave transmission from a stoichiometric H2/O2 (Pi=1 atm) CJ detonation and the subsequent jet flame is shown in Fig. 4. The data collected from this study have led to a universal correlation and fundamental gas dynamic model that accurately capture these phenomena for any shockwave transmitted by a CJ detonation in a tube (Fig. 5), regardless of the reactive mixture, initial conditions, or tube size.
 Fig 3. (left) CAD representation and (right) image of the pressure transducer rake utilized to secure piezoelectric pressure transducers near the exit of the detonation tube.
 Fig. 4. High-speed video still frame of shockwave transmission and jet flames resulting from a stoichiometric H2/O2 (Pi=1 atm) CJ detonation in a tube.

Fig. 5. Comparison of scaled overpressure data behind shockwaves transmitted from a CJ detonation exiting a tube. Data collected by Texas A&M are compared to a wide range of literature data including various reactive mixtures and tube sizes.
